
FAILED LIQUIDITY SCALPER INDICATOR-BEST FOR 3 MIN AND 5 MIN TIME FRAME
The failed liquidity scalper indicator is designed according to the smart money liquidity traps.We all know about smart money that they trap retail traders and hit the areas of their stop losses. This indicator helps us to enter into the possible trade when smart money decides to do stop loss hunting.
PRACTICAL EXAMPLE #1
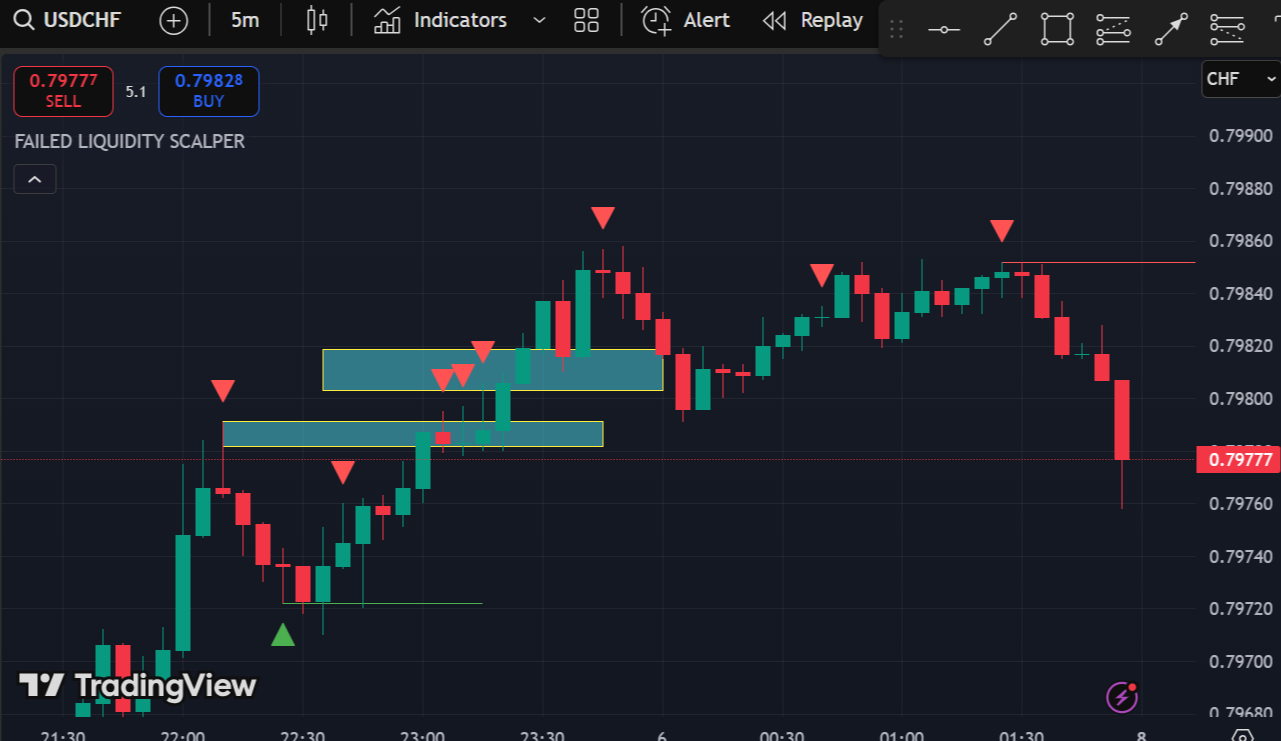
Let’s analyse the above chart. It’s the USDCHF 5-minute time frame. You can see I have marked 2 yellow levels exactly at the area where you see red arrows. We will check the behaviour of price action on these red arrows. We can also market the high of the candle where the red arrow appears.
If the price breaks the area of the red arrow above where you see the yellow level, then it means the price wants to go further up to hunt stop losses. That is the reason you can clearly see the uptrend after the price breaks above the red arrow level.
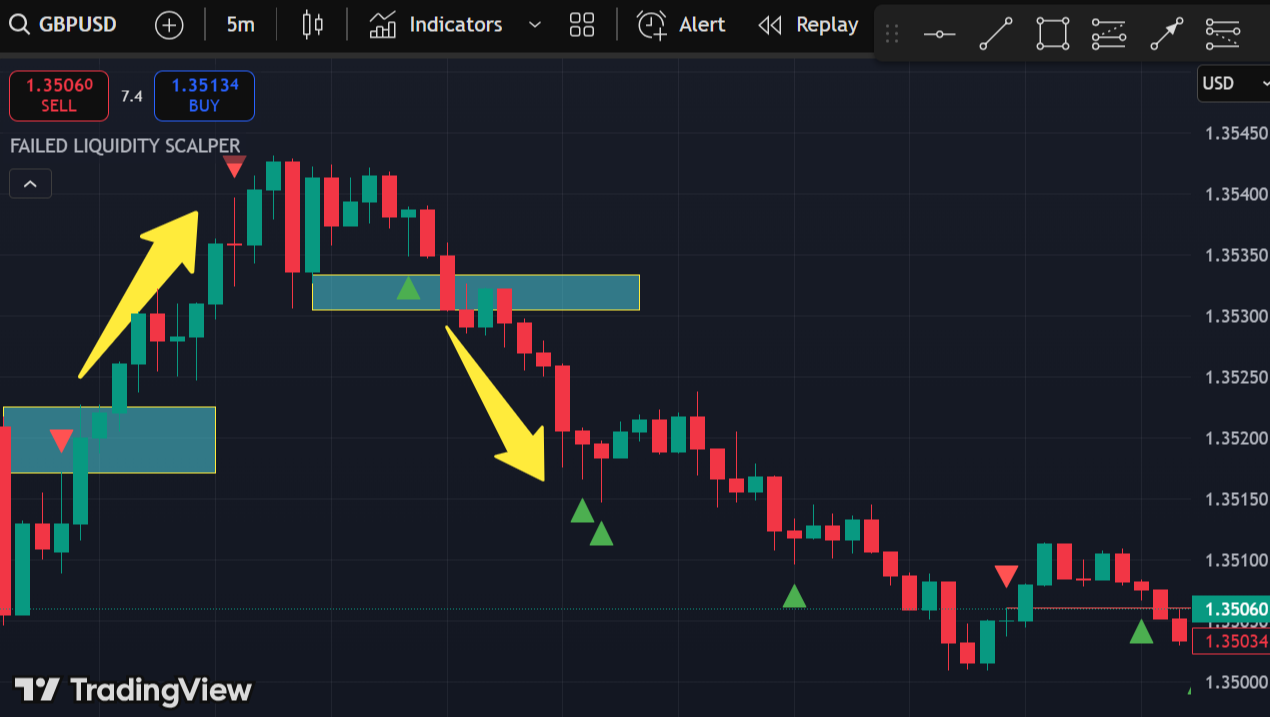
EXAMPLE #2
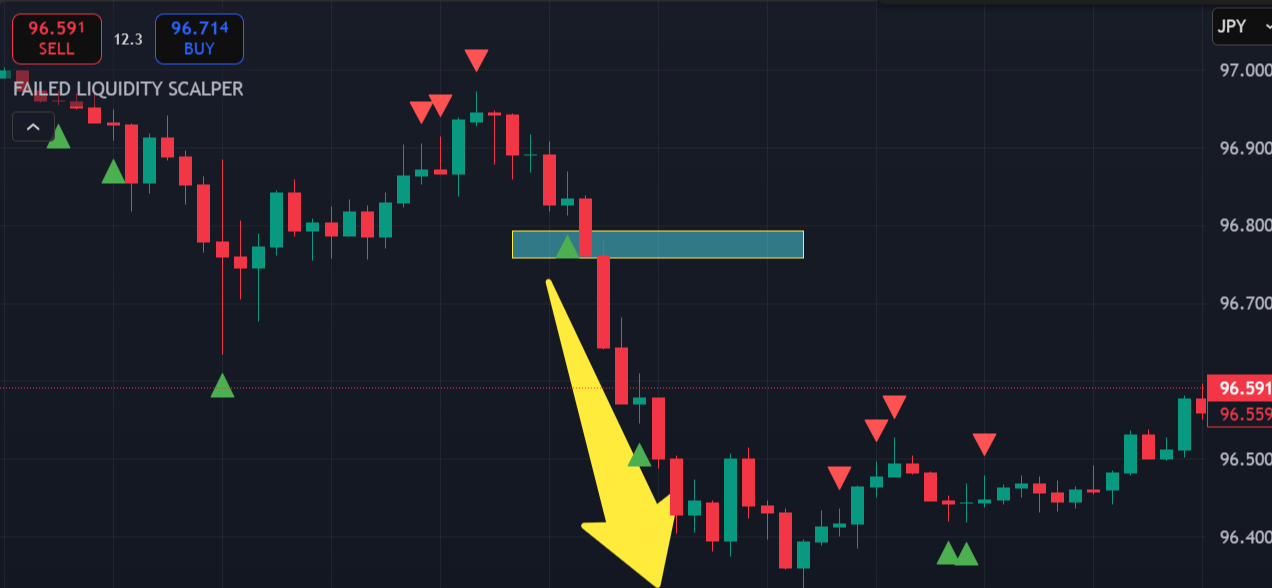
Now look at the chart above. I have marked the yellow level on the green arrow area. Now let’s reverse the whole situation. You can see price breaks below the green arrow area, so it means that it’s time to sell. Price wants to hunt the stop losses that are available on the downward side.
This is the perfect indicator for those traders who use it with a slight common sense. Liquidity is the fuel of market and that is what this indicator is based on that important concept.
Conclusion:
Its a simple indicator to use for beginners and experienced traders. When ever price breaks above red arrow its a buy. On the other hand when price breaks below green arrows its a sell.
If you want to book the lifetime version Failed Liquidity Scalper indicator, then contact us by telegram.
Contact Us On Telegram or email at fxmentor1985@gmail.com
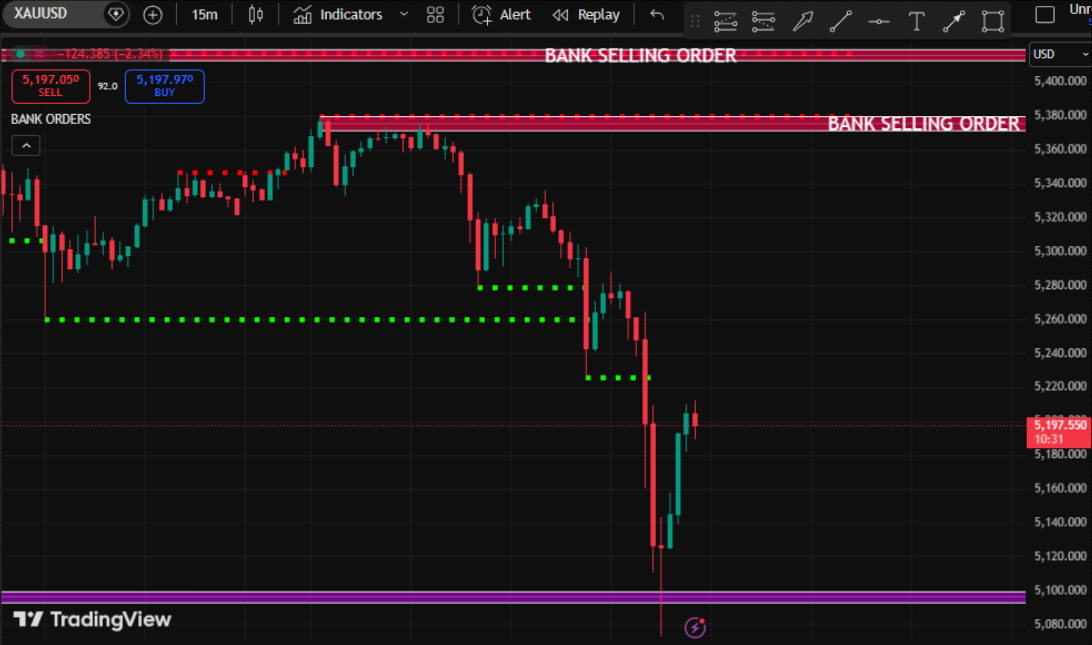
You can also check my best indicator here. BANK ORDERS INDICATOR