
Buy and Sell Trading Setup Using Moving Average on TradingView
Trading is all about timing. You should know when to buy and when to sell. Many traders use indicators to help them find good entry and exit points. One of the most popular tools for this is the Moving Average (MA).
In this article, we will explain a complete buy and sell trading setup using Moving Average on TradingView. You will learn how it works, which settings to use, and how to apply it in your trading.
What Is a Moving Average?
A Moving Average is a line that follows the price. It smooths out market noise and shows the overall trend. Instead of looking at every candle, traders use the Moving Average to see the direction of the market more clearly.
There are two main types of Moving Averages:
-
Simple Moving Average (SMA): It calculates the average price over a chosen period.
-
Exponential Moving Average (EMA): It gives more weight to recent prices, so it reacts faster.
On TradingView, you can easily add both SMA and EMA from the indicator menu.
Why Use Moving Average for Buy and Sell Signals?
The Moving Average helps you see the market trend. If the price is above the line, the market is bullish. If the price is below, the market is bearish.
When you combine two or more Moving Averages, you can build a buy and sell trading setup. This method is simple and works on any market: forex, crypto, or stocks.
Some key benefits:
-
Easy to understand for beginners.
-
Works on all timeframes.
-
Can be used for scalping, intraday, or swing trading.
-
Provides clear buy and sell signals.
Best Moving Average Settings for TradingView
The choice of settings depends on your trading style. Here are some popular ones:
-
Scalping (1m–5m chart): EMA 9 and EMA 21
-
Intraday trading (15m–1H chart): EMA 20 and EMA 50
-
Swing trading (4H–Daily chart): EMA 50 and EMA 200
Most traders use EMA because it reacts faster than SMA. But you can test both on TradingView and see what works best for you.
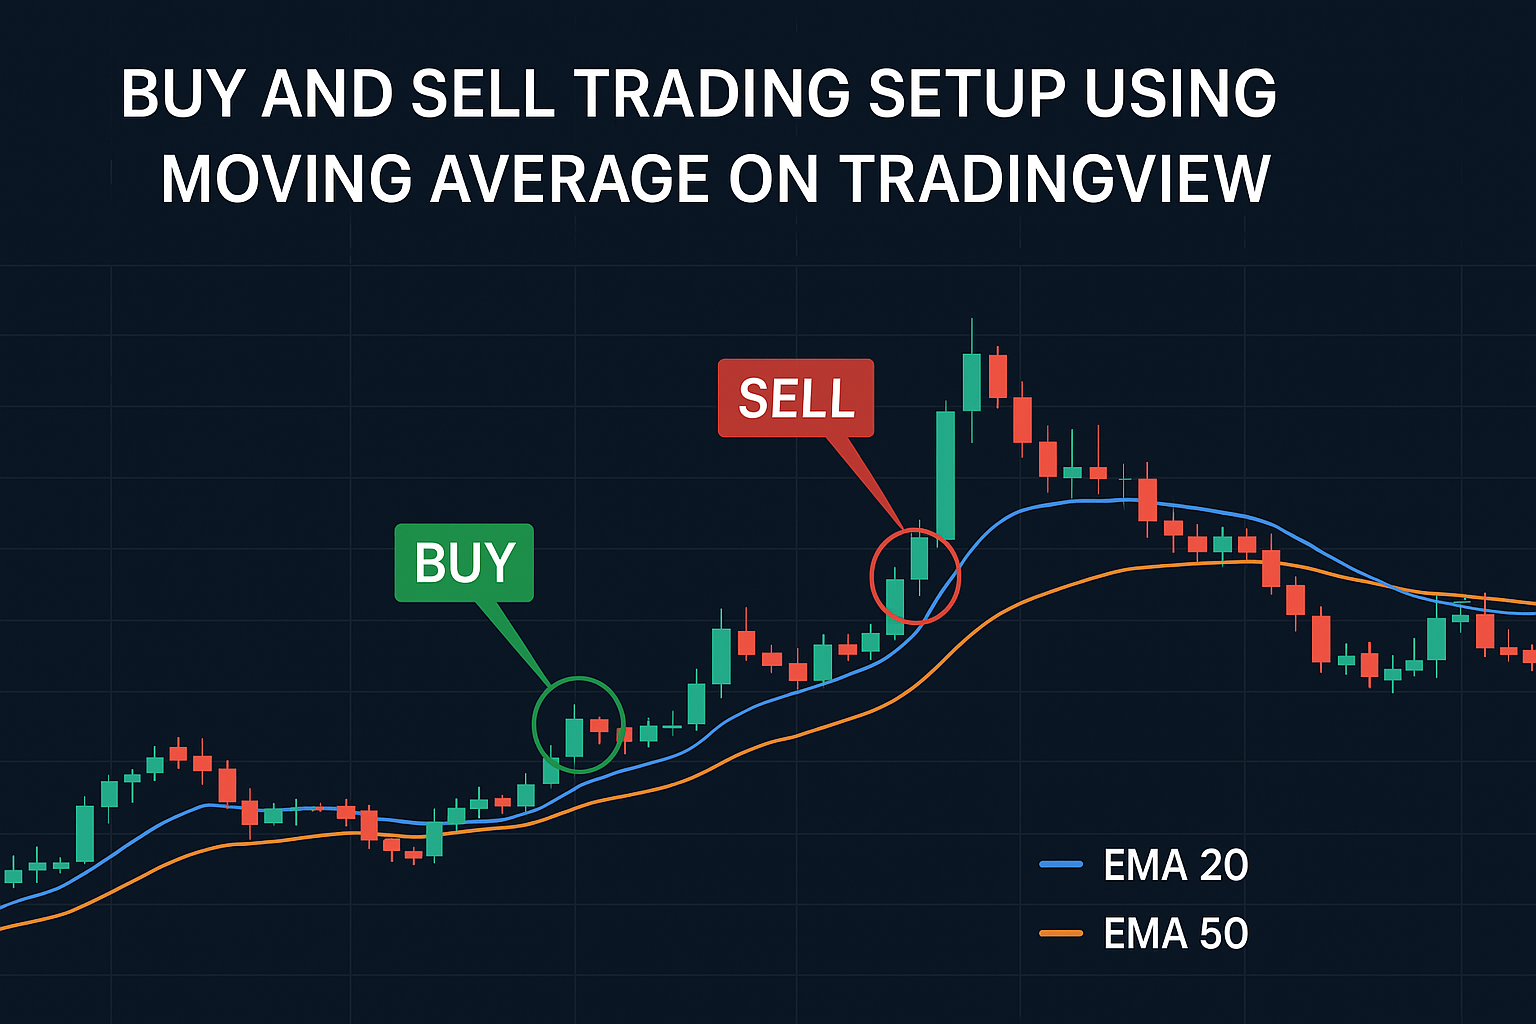
Buy Trading Setup Using Moving Average
Here’s how you can create a buy setup:
-
Add two EMAs to your chart (example: EMA 20 and EMA 50).
-
Wait for EMA 20 to cross above EMA 50.
-
Make sure the price is above both EMAs.
-
Enter a buy trade after the crossover.
-
Place a stop loss below the recent swing low.
-
Set take profit at 1.5x or 2x of your risk.
Example: On the EUR/USD 15-minute chart, if EMA 20 crosses above EMA 50, and candles close above, it gives a strong buy signal.
Sell Trading Setup Using Moving Average
Now let’s look at the sell setup:
-
Add the same EMAs (example: EMA 20 and EMA 50).
-
Wait for EMA 20 to cross below EMA 50.
-
Make sure the price is below both EMAs.
-
Enter a sell trade after the crossover.
-
Place a stop loss above the recent swing high.
-
Set take profit at 1.5x or 2x of your risk.
Example: On the Bitcoin 1-hour chart, if EMA 20 crosses below EMA 50, and candles close under both, it’s a strong sell signal.
Extra Tips for More Accuracy
Moving Averages alone are good, but you can make them even stronger by combining them with other tools:
-
RSI: Use it to confirm overbought or oversold conditions.
-
Volume: A crossover with strong volume is more reliable.
-
Support & Resistance: Place trades only near key levels.
-
Multiple Time Frame Analysis: Check higher timeframes for trend confirmation.
Common Mistakes Traders Make
Many traders fail with Moving Average setups because they make simple mistakes:
-
Using too many Moving Averages at once.
-
Trading every crossover without confirmation.
-
Ignoring market news and events.
-
Not using stop loss.
-
Expecting Moving Averages to predict the market 100%.
Remember: indicators help, but they are not magic. Combine them with discipline and risk management.
Example of a Complete Trade
Let’s walk through a real example:
-
Market: GBP/USD
-
Timeframe: 15 minutes
-
Indicators: EMA 20 and EMA 50
-
EMA 20 crosses above EMA 50.
-
Price stays above both EMAs.
-
RSI shows bullish momentum.
-
Buy trade taken at 1.2650.
-
Stop loss at 1.2630 (20 pips).
-
Take profit at 1.2690 (40 pips).
Result: The trade hit the take profit for a 2x reward.
Why Use TradingView for Moving Averages?
TradingView makes trading easier:
-
Clean charts.
-
Easy access to EMAs and SMAs.
-
You can test different settings quickly.
-
Free and paid versions available.
-
Ability to use custom indicators.
If you want more accuracy, you can even upgrade to premium TradingView indicators that filter false signals and give early entries.
Conclusion
The buy and sell trading setup using Moving Average on TradingView is one of the simplest yet powerful strategies. By using two EMAs, traders can catch trends early and exit with profit.
To succeed, always:
-
Choose the right settings for your style.
-
Confirm signals with extra tools.
-
Protect your trades with a stop loss.
-
Stay patient and disciplined.
TradingView provides all the tools you need, and if you want even better results, you can try custom premium indicators. They save time, reduce mistakes, and give you more confidence in your trading.
Key Takeaways:
-
Moving Averages are simple but powerful tools.
-
EMA crossover setups give clear buy and sell signals.
-
Works for scalping, intraday, and swing trading.
-
Combine with RSI, volume, or support/resistance for better accuracy.
-
Always use stop loss and proper risk management.
If you are looking for a trusted broker with fast execution and low spreads, I recommend trading with