Supercharge Your Trading with The Ultimate Scalping Indicator Tradingview
Scalping Indicator Tradingview is one of the best reversal indicators and most of the traders are using this indicator. This 5-minute scalping indicator tradingview is super easy to use and anyone can use it to generate a handsome amount from trading. Furthermore, Its default chart looks like a simple arrow indicator with an average win rate.
Performance
Scalping indicator trading view needs to be used with optimized settings and the correct time frame to increase its performance. In addition, Its accuracy in predicting signals increases after these optimized settings. These settings play a key role in enhancing the accuracy of signals. After testing this indicator, we found that this scalping indicator has an average accuracy of 85% which is good for any scalping indicator..
Steps to attach forex scalping indicator tradingview
Follow the steps given below to attach this Scalping indicator tradingview.
- Open a fresh trading view chart.
- Moreover, you should switch your time frame to 1 minute or 5 minutes.
- Tap on the indicators tab.
- Search for Edri Extreme Points Buy & Sell by Spudow.
Features Of Edri Extreme Points
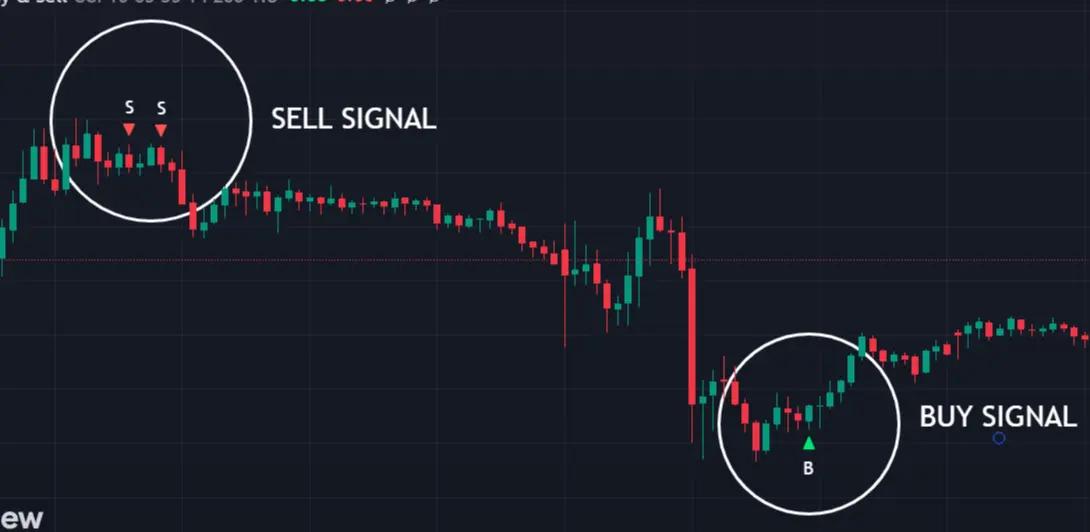
Once this indicator is applied to your chart you will find red and green triangles are shown. These red and green triangles predict the price reversal of the stock trading. This non-repaint scalping indicator tradingview does not repaint. Default settings show many false signals, to avoid these false signals we have to adjust its settings.
Settings Of Scalping Indicator Tradingview
To increase the accuracy of this indicator and to avoid false reversal signals you should optimize these settings.
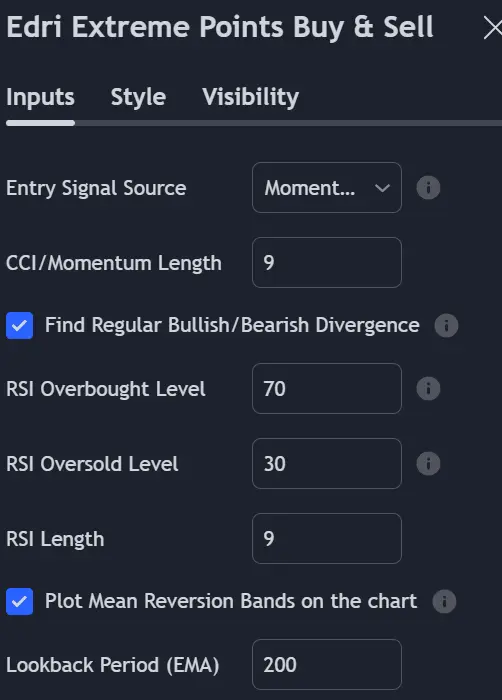
- In the Input tab alter the Entry Signal Source from CCI to Momentum.
- Next, Change the Momentum Length from 10 to 9.
- Change the RSI Overbought Level from 65 to 70.
- Adjust the RSI Oversold Level from 35 to 30.
- Adjust RSI Length to 9.
- Similarly, set the Lookback Period to 200 and Multiplier to 1.8.
- Don’t forget to check the Plot Mean Reversion Bands on the chart.
- Tap the OK button to save all the settings.
Scalping Strategy
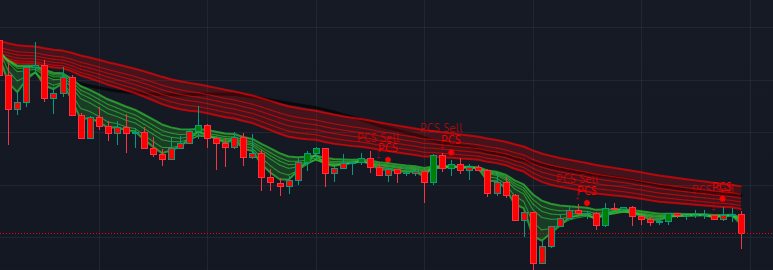
This indicator works based on bands. These bands will help us to know the entry points and we will use them to understand when to enter the trade or exit the trade. Once the settings are applied you will notice that the number of signals has been reduced and all the false signals are removed. When we were testing this indicator with these settings it gave an 82%-win rate. Now let’s see how to take proper buy and sell trades.
Buy Strategy
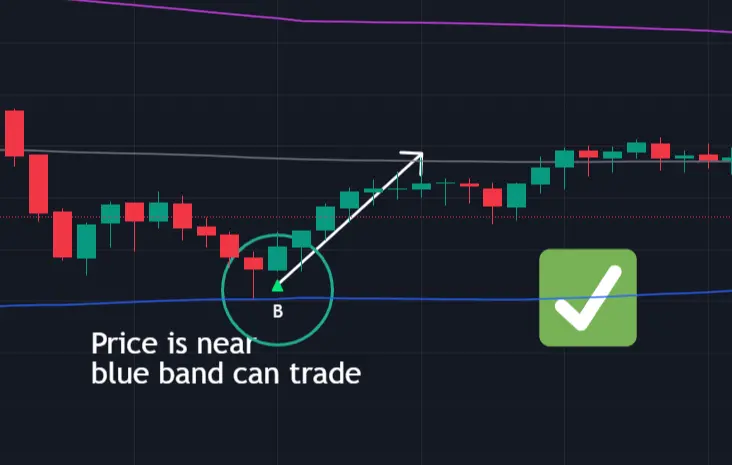
With the help of Scalping Indicator Tradingview, you can take a buy trade whenever a green signal appears, wait for a fresh candle to form, and make sure that the price is near or outside the blue band of mean reversion. If the market is not outside or near the blue band. Avoid these signals.
Buy Example:
The buy signal appeared and the price was near the blue band, and a fresh candle formed. All the conditions are fulfilled in this example so now you can execute buy trade.
Sell Strategy
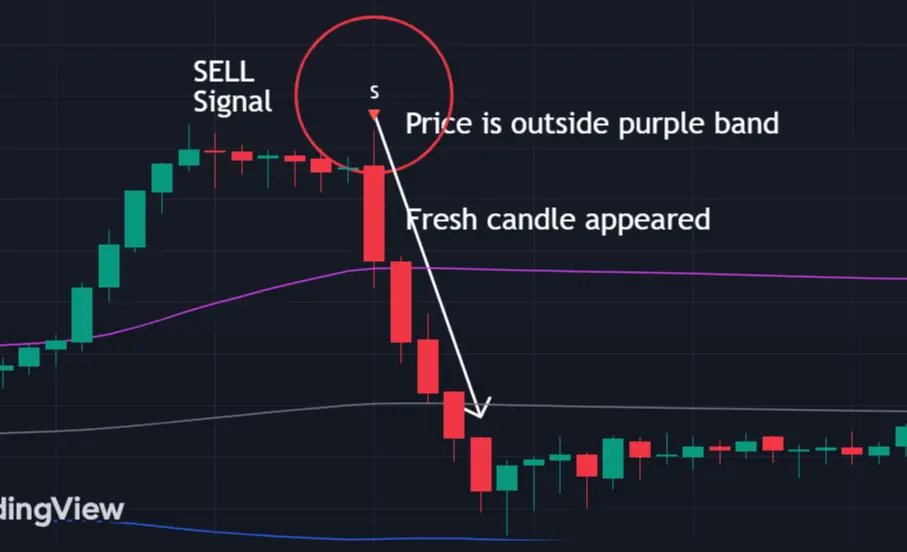
For using this Scalping Indicator Tradingview, you are required to take a sell signal if a red signal (Sell Signal) appears and wait for a fresh candle to form. In this scenario, we will monitor the purple band. The price should be near or outside the purple band. Moreover, wait for a fresh candle to form and then execute the sell trade. If the market is not outside or near the purple band avoid these signals.
Sell Example:
The sell signal appeared and the price was outside the purple band, Fresh candle appeared, and now you can execute the sell trade. Sometimes signals will not be near the lines so avoid these signals.
Signals to Avoid
This strategy works on a 1-minute scalping indicator trading view and a 5-minute scalping indicator tradingview. Since this is a scalping strategy and we are using it in short time frames that’s why proper risk management system is necessary. If there is a red signal and it’s far from the purple band simply avoid these signals as the potential reversal of the market is unknown in such conditions and if the buy signal is too close to the purple band do not execute a trade here.
Stop Loss
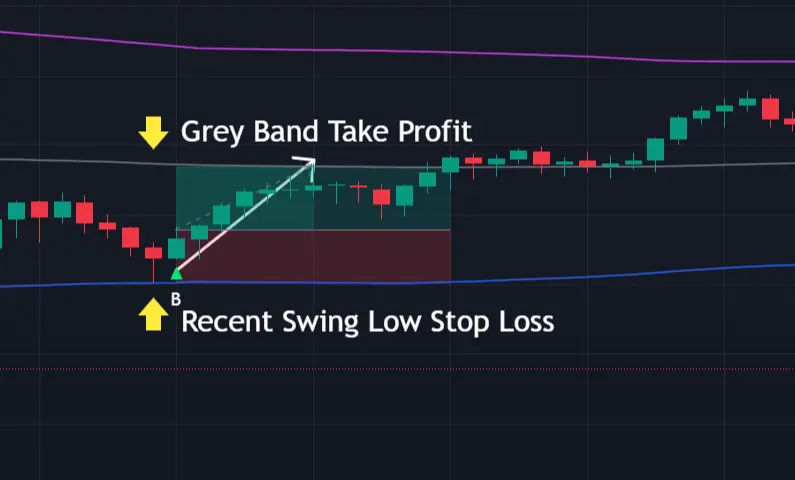
For stop loss, you must use the recent swing low and recent swing high.
Take Profit
Likewise, for taking profit you should use the central grey line as a target profit this will give stable risk management. Exit the trade as the price touches the central grey line.
Conclusion
Scalping Indicator Tradingview is one of the best indicators. You can also use it in a short time frame and scalping. Its strategy is simple you can execute a trade when the signal appears, a fresh candle forms and the market is near or outside the band. The grey band indicates the target profit band. Moreover, Good price management and using this indicator with these rules can help you get maximum profit.
If you want to join the best-regulated broker that offers you low spreads then please click on the button given below.
If you are interested in 1 to 1 live coaching session then please click here.


