New Artificial Intelligence Indicator Beats All Tradingview Indicators
Artificial Intelligence Indicator is widely used to optimize your trading. In this world of AI, just imagine using an indicator with precise signals about market movements. Despite the hype about AI, you might not have heard about its role in trading. After observing the market closely, we have found that the artificial intelligence indicator predicts the future. This artificial intelligence trading indicator gives the most accurate trading signals.
Indicator Name and Author
The most accurate artificial intelligence indicator for trading is Machine Learning: Logistic Regression by Capissimo.

This indicator is one of the developer’s picks.
Adding Indicator to your Chart
To add this indicator, you have to navigate towards tradingview.com. Go to the indicators section and search for Machine Learning: Logistic Regression. Now save this tool to make sure about its availability. Here you go machine learning and artificial intelligence indicator is added to your chart.
Key Features of Artificial Intelligence Indicator
This artificial intelligence trading indicator works based on Artificial Intelligence which alludes to the vast field of computer science. This indicator processes information much faster than a normal human being can. This indicator uses a machine called logistic regression for its precise signals.
How to use a Machine Learning Indicator
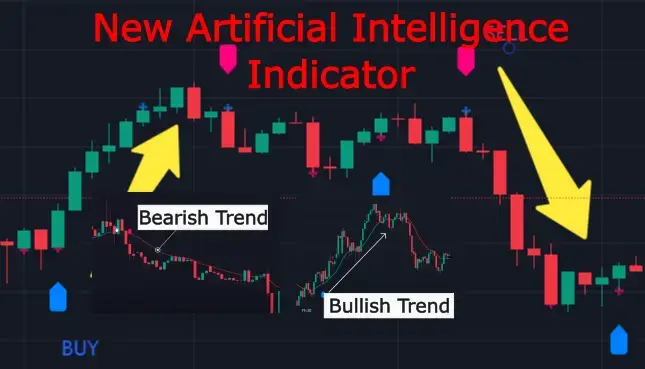
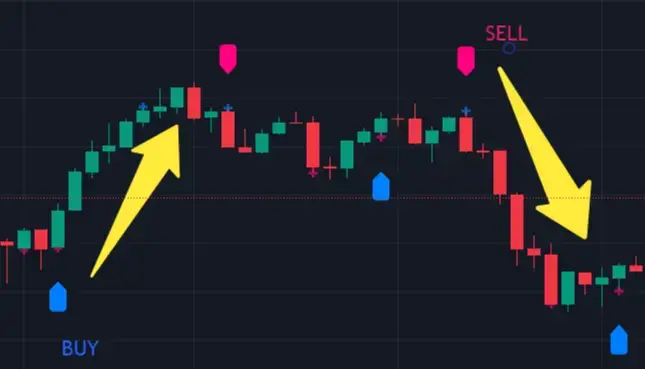
This indicator will predict whether the price of any pair will increase or decrease. This indicator shows pink and blue arrows to indicate buy and sell positions. Here you can check its accuracy as shown in the picture below the Buy signal was given and the market went up on the other hand when the sell signal appeared the market went down.
Settings
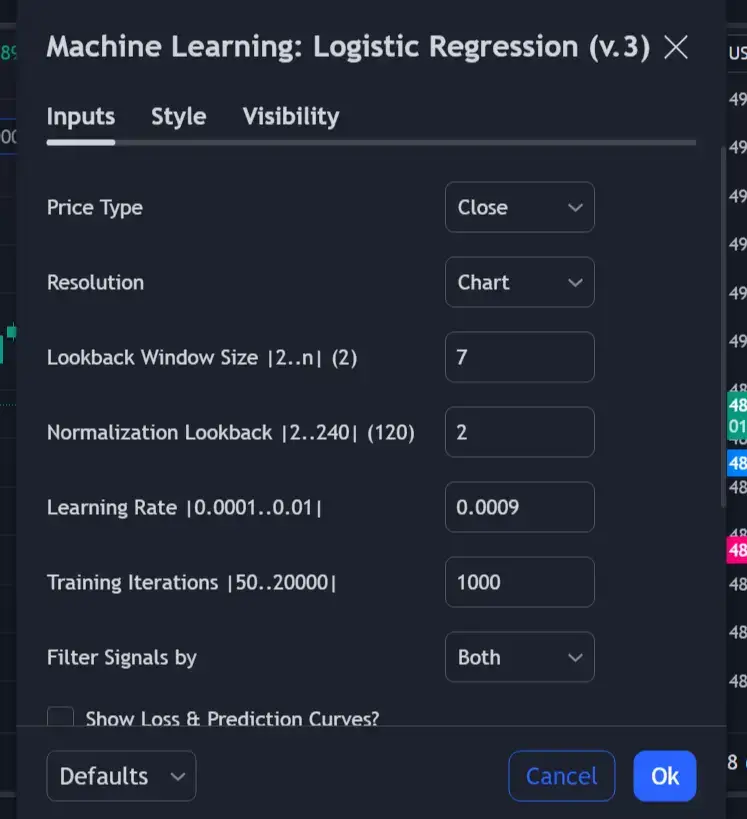
Default settings are good for scalping or short-term trading. I will recommend you adjust its settings for medium-term trading. Here are a few steps.
- Set Look back window to 7 to give long-term signals.
- Lookback window size, Normalization lookback, Learning Rate, and Training Iterations will remain the same.
- The final setting, we will adjust is to change the filter to (Both).
All the settings are shown below in the picture.
Key Features
This new artificial intelligence trading view indicator gets an insane win rate and you will also notice this indicator also gives critical details like the current win rate at the end of the current candle stick. Unfortunately, this critical information is not very clear as you cannot change text color but you can change the background color so that it can be visible.
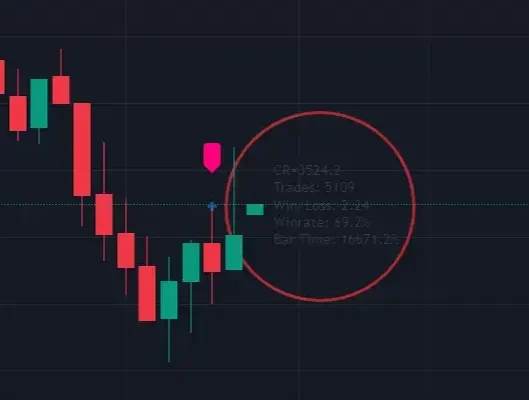
As we can see in the above picture this indicator has a 69.2%-win rate in the past ten thousand trades which is impressive. We will use this Machine Learning: Logistic Regression indicator for entries.
Adding another indicator to determine directions
Last but not least we are going to attach the second indicator to determine the directions that will predict more accurate signals. Go to the indicator tab and search for the Lorentzian Classification by Jdehorty. new artificial intelligence indicator beats all tradingview indicators
Artificial Intelligence Indicator is widely used to optimize your trading. In this world of AI, just imagine using an indicator with precise signals about market movements. Despite the hype about AI, you might not have heard about its role in trading. Moreover, after observing the market closely, we have found that the artificial intelligence indicator predicts the future. This artificial intelligence trading indicator gives the most accurate trading signals.

Attach this indicator to your chart. This indicator capitalizes on Artificial Intelligence to predict trend directions.
Settings
We will use only one feature (Kernel Estimate) from this indicator.
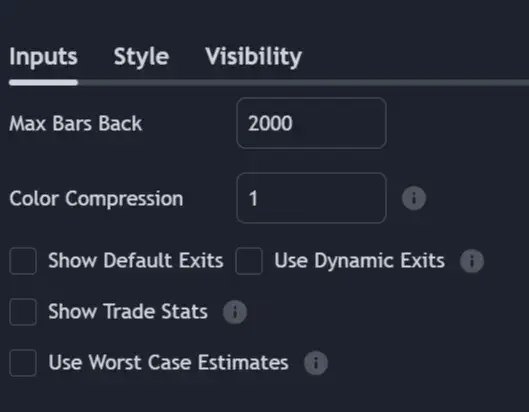
- Go to the settings of the Lorentzian Classification input tab and disable all other options.
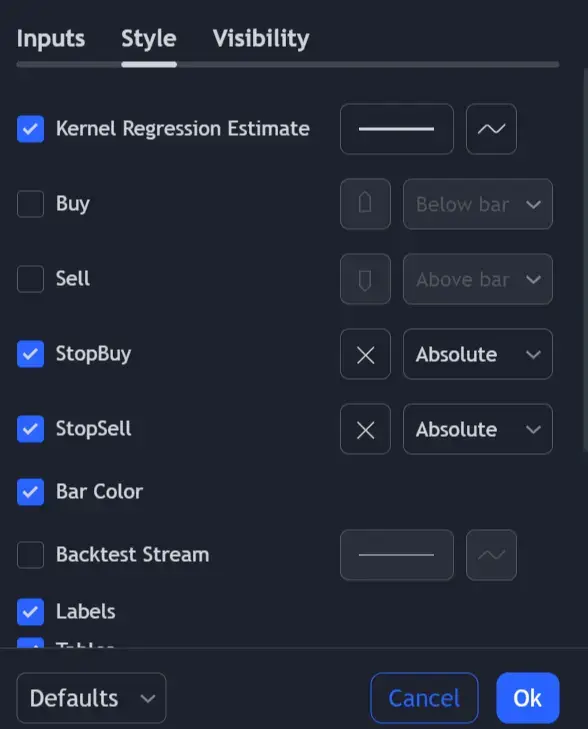
- Now go into the style tab and disable buy and sell labels.
Strategy
Its Strategy is simple this indicator shows kernels.
Bearish Trend:
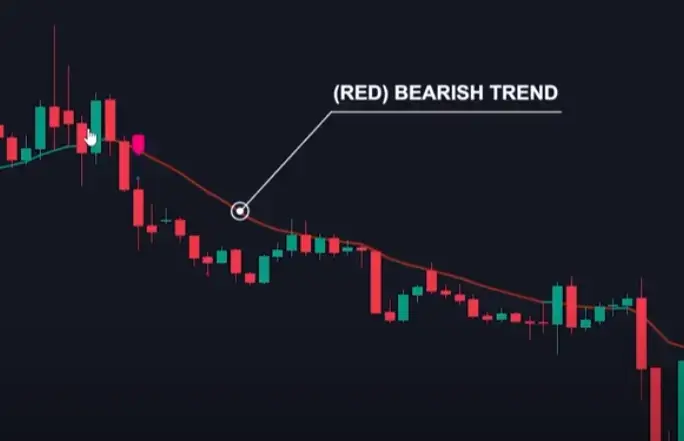
we have to wait for the kernel to change its color if the kernel is red, it is a bearish trend, and then you have to wait for the first indicator to give a sell signal now it is time to take the entry and set a stop loss above the candle high.
You can hold the trade until another opposite signal appears.
Bullish Trend:
If the kernel changes its color to green it is a bullish trend and the other indicator also gives a buy signal at this time you can take your buy order.
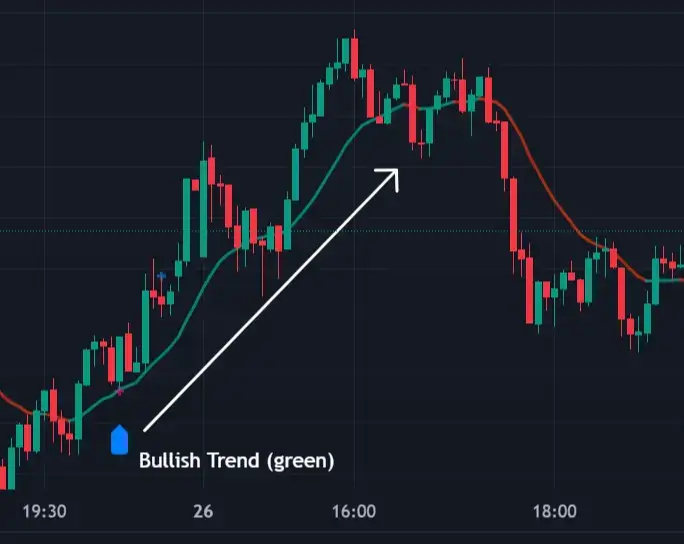
However, trades can go against us but no problem algorithm will correct automatically and give the right signal in the right direction. Each signal shows a label to indicate whether the trade is a win or loss which increases the win rate automatically. By Following these simple rules, you can increase your success rate.
More Optimized Indicator
If you want more optimized indicators for both trend lines and entries check out the Lux all Go premium toolkit. In fact, this indicator is developed by industry-leading programmers. Tool kit tracer indicator traces the trend which predicts more precise and accurate signals. Above all, It consists of a built-in signals algorithm that gives a more accurate prediction of market movement.
You can also check our other indicator’s recommendations here.
Conclusion
We suggest you use these indicators with Artificial Intelligence Indicator and careful risk management to optimize your trading.
If you want to join the best broker that is regulated and offers you low spreads then please join this broker from the link given below.

