
This SECRET TradingView Indicator 2026! The Most Accurate BUY & SELL Indicator
The ADR trading indicator help traders to trade in realistic ranges. Its completely a range based indicator. The average daily range (adr) calculates the different in between the high and low of an asset depending on specific numbers of days. The adr indicator main focus remains on the daily candle.
It measure the average range over the last number of specified days. Moreover, it also calculates the current range based on today’s opening price.It also check the unused volatility left behind in the zone.
How to Attach ADR Indicator on Trading View:
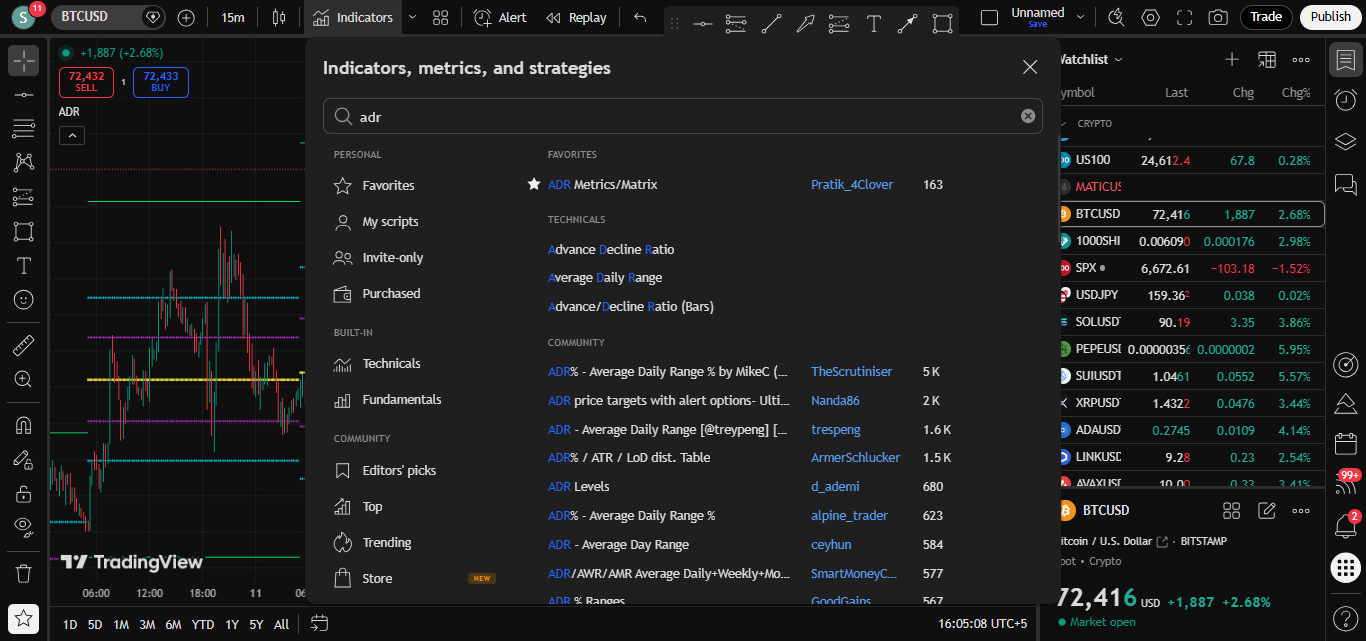
In order to attach this indicator type ADR in indicator section on trading view. Choose the one that shows ADR Metrics/ Matrix by Patrick_4Clover.
How to Trade using ADR Metrics Indicator:
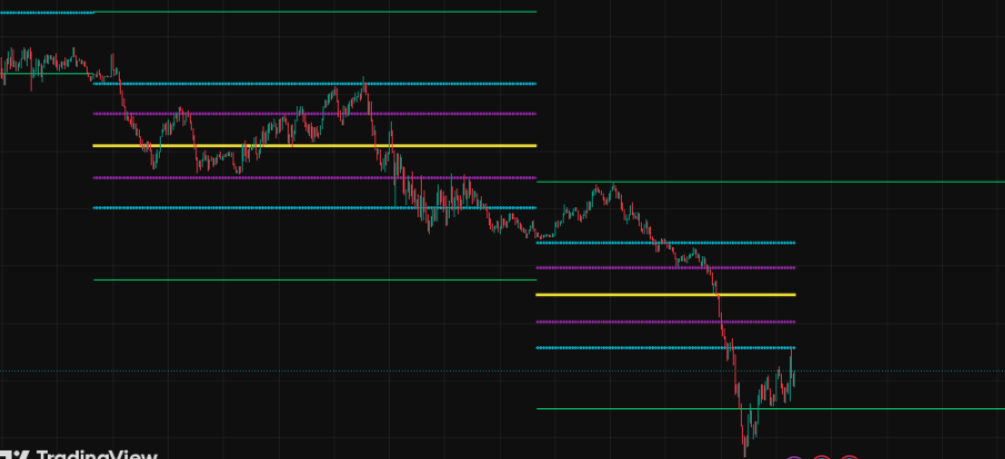
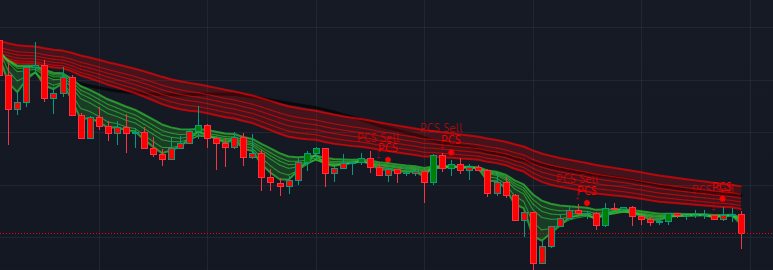
Now look at this above chart we can see there are lot of ranges inside the green 2 ranges.Now here, the trend plays important part. For example if we check the range area on the right hand side of chart we can understand price is in the down trend. So, we can wait for a slight pullback from every range and then we enter into sell position based on targeting the next lower range.
Moreover, we can continue this pattern till the price liquidates the green line. Now green line in my point of view is very important because its telling us price hit the stop losses of many retail traders. From this green line we can play our buy position and we can stop working on selling anymore.
LETS STUDY ONE MORE RANGE
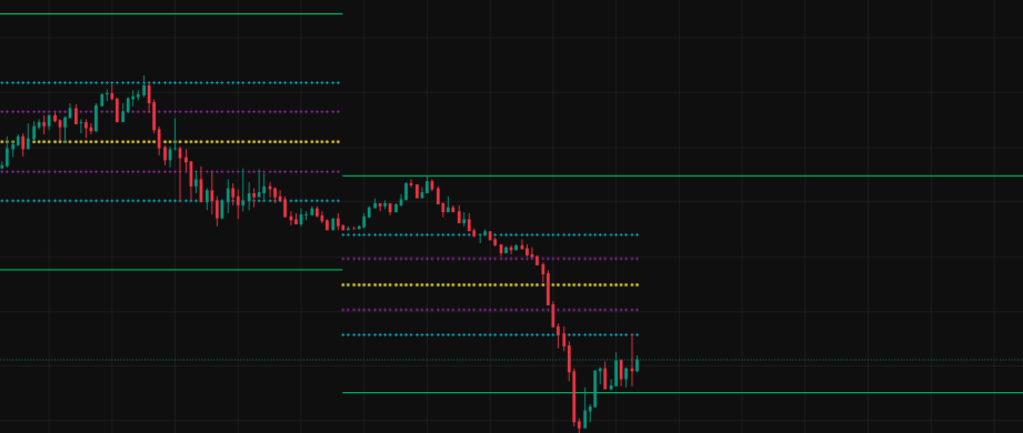
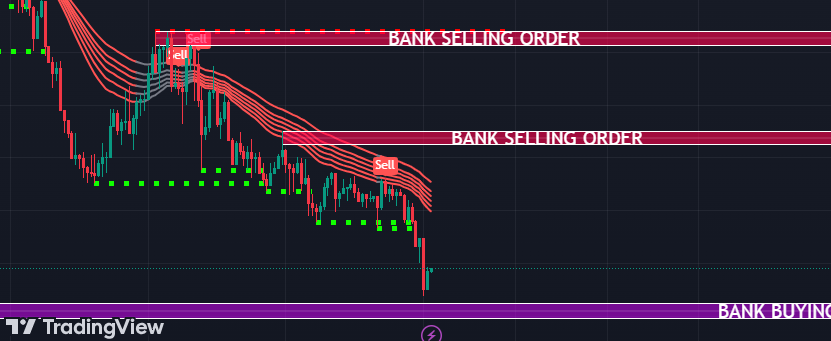
Now we have 2 more screenshots. From the first screenshot we can see price turns bearish from the green level and it continued the bearish pattern till the next green line at the bottom. In normal market conditions we have seen that after liquidating one level price moves to liquidate the second level and exactly the same happened in the first screenshot.
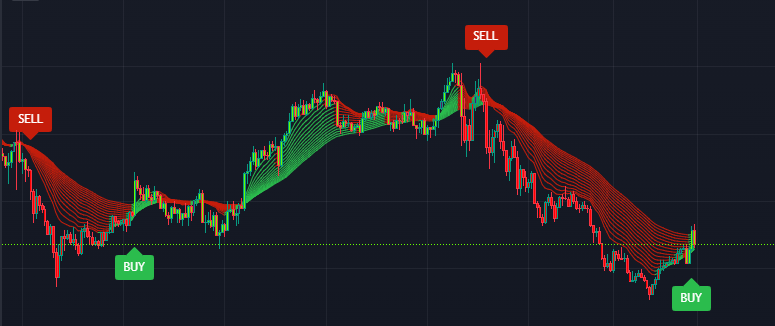
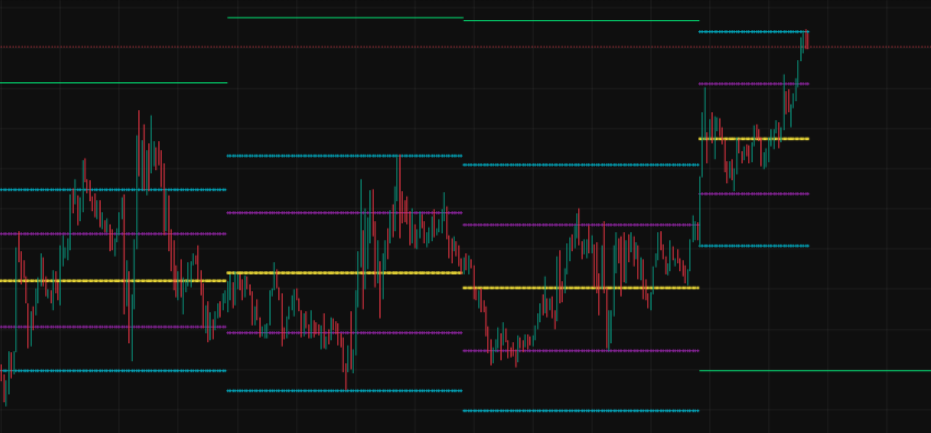
In the second screenshot most of the time price kept itself away from the green line. Here we need to act smarter. If the price is breaking range towards upside we will be looking to buy and if the price is breaking range upside to downside generating a bearish pressure then we will be looking to sell.
Market Turning Points Indicator
In order to book the life time version of my secret tradingview indicators Contact Us On Telegram or email at fxmentor1985@gmail.com