

How to Trade Golden Cross and Death Cross on TradingView
Trading is about finding the right entry and exit points. One of the most popular signals that traders use is the Golden Cross and Death Cross. These signals come from moving averages and can be used on any market. In this article, you will learn how to trade them using TradingView.
What Is a Golden Cross?
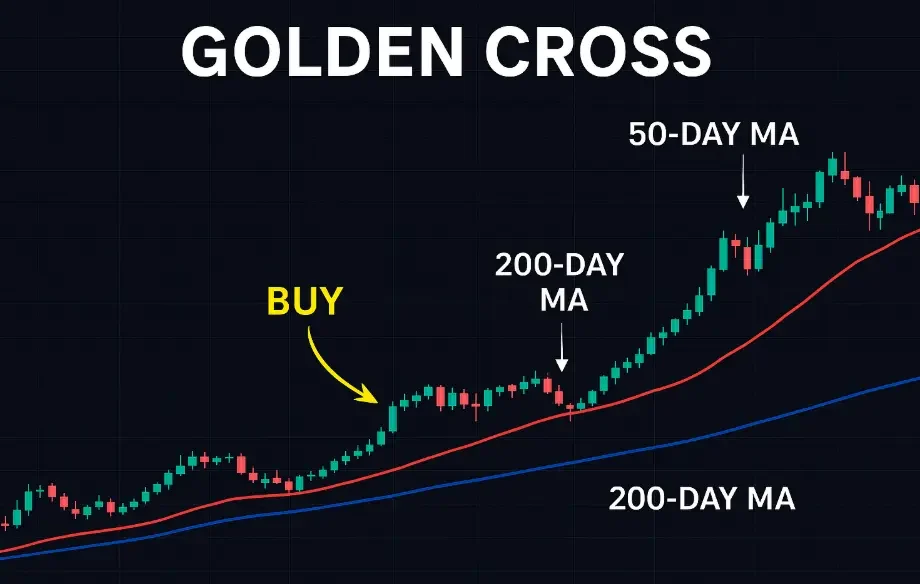
A Golden Cross happens when a short-term moving average crosses above a long-term moving average.
-
The most common setup uses the 50-day moving average (MA) and the 200-day moving average (MA).
-
When the 50-day MA moves above the 200-day MA, it shows strong buying pressure.
-
Traders see it as the start of a possible uptrend.
On TradingView, you can easily add moving averages and see this signal on the chart.
What Is a Death Cross?
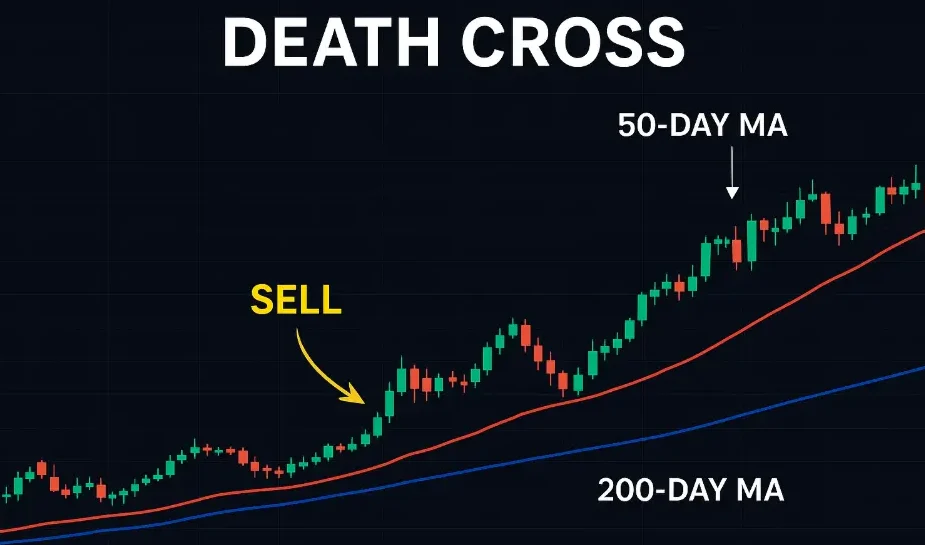
A Death Cross is the opposite of the Golden Cross.
-
It happens when a short-term moving average crosses below a long-term moving average.
-
The most common signal is when the 50-day MA falls under the 200-day MA.
-
This shows selling pressure and can be the start of a downtrend.
Traders use this signal to look for short positions or exit their long trades.
How to Spot Golden Cross and Death Cross on TradingView
TradingView makes it easy to spot both signals. Follow these steps:
-
Open the TradingView chart of your chosen asset.
-
Go to the Indicators menu.
-
Search for Moving Average and add it twice.
-
Change the first MA length to 50.
-
Change the second MA length to 200.
-
Adjust the colors to make them easy to see.
Now you can spot the Golden Cross when the 50 MA moves above the 200 MA. The Death Cross appears when the 50 MA moves below the 200 MA.
Why Traders Use Golden and Death Cross
These signals are simple but powerful.
-
They show the overall trend direction.
-
They work well for long-term trading.
-
They can be used on stocks, forex, crypto, and commodities.
-
They help traders avoid trading against the main trend.
However, they are not perfect. The signals may come late because moving averages are lagging indicators.
Trading Setup with Golden Cross
Here’s a basic setup:
-
Wait for the Golden Cross to happen.
-
Enter a buy trade when the 50 MA crosses above the 200 MA.
-
Place your stop-loss below the recent swing low.
-
Target a higher resistance area or use a risk-reward ratio like 1:2.
This method works best on higher timeframes like the daily chart.
Trading Setup with Death Cross
Here’s a simple sell setup:
-
Wait for the Death Cross to form.
-
Enter a sell trade when the 50 MA goes below the 200 MA.
-
Place your stop-loss above the recent swing high.
-
Aim for the next support area or use a risk-reward ratio.
This strategy is useful when markets are in a strong downtrend.
Using Golden and Death Cross in Different Markets
-
Forex Trading: These signals work well on major currency pairs like EUR/USD or GBP/USD.
-
Stock Market: Many long-term investors buy stocks when a Golden Cross forms.
-
Crypto Trading: Bitcoin traders often watch Golden Cross and Death Cross to predict big moves.
-
Indices: Indices like the S&P 500 also react strongly to these signals.
You can try them on different charts in TradingView to see which market gives the best results.
Combine Golden Cross and Death Cross with Other Indicators
To reduce false signals, combine them with other tools:
-
RSI (Relative Strength Index) to check overbought and oversold conditions.
-
MACD (Moving Average Convergence Divergence) for extra trend confirmation.
-
Volume Indicator to confirm strong buying or selling activity.
On TradingView, you can add these indicators for free and build a complete setup.
Pros and Cons of Golden Cross and Death Cross
Pros:
-
Easy to understand.
-
Works on all markets.
-
Good for spotting long-term trends.
Cons:
-
Signals can be delayed.
-
Not always accurate in sideways markets.
-
Works better with confirmation tools.
Best Timeframe to Trade
-
Daily chart: Most reliable for long-term trading.
-
4-hour chart: Useful for swing traders.
-
1-hour chart: Can be used for short-term trades but may give false signals.
If you are new, it’s better to stick with the daily timeframe.
Example of Golden and Death Cross on TradingView
Let’s take an example:
-
On Bitcoin, a Golden Cross formed in 2020. After that, the price moved up strongly.
-
Later, a Death Cross happened in 2021, signaling a downtrend.
These examples show how powerful these signals can be when used correctly.
Risk Management with Golden and Death Cross
Always use risk management:
-
Risk only 1–2% of your capital per trade.
-
Always place a stop-loss.
-
Avoid trading during low liquidity hours.
-
Use a clear risk-reward ratio.
Even strong signals can fail, so managing your risk is key.
Conclusion
The Golden Cross and Death Cross are simple but powerful tools. They help traders understand trend changes and create strong buy or sell setups. On TradingView, you can easily apply moving averages to find these signals.
If you are a beginner, start by testing them on demo accounts. Combine them with other Premium indicators for better accuracy. With practice, you can use these signals to make confident trading decisions.
Trade with my recommended best broker for low spreads and fast execution.